Hero Image Custom Metrics
The takeaways from this post are:
- If your website has a hero image, make sure it loads and renders as early as possible. Many designs that feature a hero image suffer from HID (Hero Image Delay) mostly due to blocking scripts and stylesheets.
- You should add custom metrics to your website to make sure you know how quickly (or slowly) important content gets displayed. I’ll describe a new technique for measuring when images are rendered so you can track that as a custom metric.
HID (Hero Image Delay)
The size of websites is growing. The average website contains over 2 MB of downloaded content. Of that, 1.3 MB (65%) is images. Many websites use images as a major design element in the page – these are called hero images. Because these hero images are critical design elements, it’s important that they render quickly, and yet often hero images load too late frequently getting pre-empted by less critical resources on the page.
Popular websites that use hero images include Jawbone, Homeaway, and Airbnb. Using SpeedCurve’s Responsive Design Dashboard, we can see how their hero images load over time across different screen sizes.
Jawbone
Jawbone’s site features an image of a woman in a sweater wearing the Up fitness tracker. While this picture is stunning, it takes 2.5-3.5 seconds before it’s displayed.

Figure 1: Jawbone Responsive Design Dashboard
Often we think that’s the price we have to pay for rich images like this – they simply take longer to download. But investigating further we find that’s often not the cause of the delayed rendering. Looking at the waterfall chart for Jawbone in Figure 2, we see that the image loaded in ~700 ms. (Look for the white URL ending in “sweater-2000.v2.jpg”.)
So why didn’t the hero image get rendered until almost 2600 ms? First, it’s referenced as a background image in a stylesheet. That means the browser’s preloader can’t find it for early downloading and the browser isn’t even aware of the image’s URL until after the stylesheet is downloaded and its rules are parsed and applied to the page. All of this means the image doesn’t even start downloading until ~650 ms after the HTML document arrives. Even after the image finishes downloading it’s blocked from rendering for ~550 ms by the scripts in the page.

Figure 2: Jawbone waterfall
Homeaway
Homeaway’s entire front page is one big hero image. Without the image, the page looks broken with a gray background and a floating form. For larger screen sizes, the hero image isn’t shown for over 2.5 seconds.
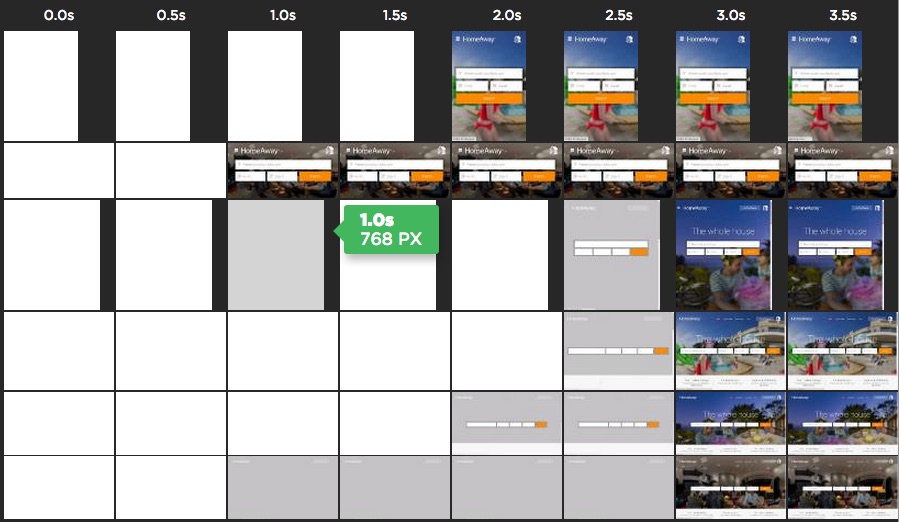
Figure 3: Homeaway Responsive Design Dashboard
The Homeaway waterfall in Figure 4 shows that the (initial, low-res version of the) hero image loads early and quickly (request #9). But then it’s blocked from rendering for over 2 seconds by other scripts in the page.

Figure 4: Homeaway waterfall
Airbnb
Similar to Homeaway, Airbnb uses a beautiful hero image to cover nearly the entire front page. But again, this critical hero image is blocked from rendering for 1.5 to 2.5 seconds.

Figure 5: Airbnb Responsive Design Dashboard
Once again, the hero image is blocked from rendering because of the many scripts on the page, but Airbnb’s waterfall shows an interesting effect of the preloader. While the preloader, overall, makes pages load much quicker, in this case it actually hurts the user experience for Airbnb users. The Airbnb home page puts several scripts at the bottom of the page, but doesn’t load them asynchronously. While moving scripts to the bottom was a good performance optimization in 2007, that was before preloaders were created. Today, for optimal performance it’s important to load scripts asynchronously.
In this case, when Airbnb is loaded in a modern browser those scripts at the bottom get scheduled earlier by the preloader and end up being requests 3, 5, 6 and 9. They add up to 238K of gzipped JavaScript. Ungzipped it turns into 797K of JavaScript that has to be parsed and executed before the hero image can be displayed.

Figure 6: Airbnb waterfall
Image Custom Metrics
Most of the performance metrics used today focus on the mechanics of the browser (window.onload) or network performance (time to first byte and Resource Timing). Unfortunately, these don’t tell us enough about what matters the most: the user’s experience. When does the page’s content get shown to the user so she can start interacting with the page?
To measure what matters, we need to shift our focus to metrics that better represent the user experience. These metrics are specific to each individual website measuring the most important design elements on each page. Because they must be created on a case-by-case basis we call them custom metrics. The earliest and most well known example of a custom metric is in a 2012 article from Twitter where they describe how their most important performance metric is Time to First Tweet, defined as “the amount of time it takes from navigation (clicking the link) to viewing the first Tweet on each page’s timeline.” Note that they don’t talk about how long it takes to download the tweets. Instead, they care about when the tweet can be viewed.
Sites that have hero images need to do the same thing: focus on when the hero image is viewed. This is trickier than it sounds. There are no hooks in today’s browsers that can be used to know when content is viewable. But we can find a solution by thinking about the three things that block an image from rendering: synchronous scripts, stylesheets, and the image itself being slow.
Talking to some web performance experts (thanks Philip, Pat, Scott, Andy and Paul!), I identified five candidate techniques for measuring when an image is displayed:
I created a test page that has a synchronous script, a stylesheet, and an image that are programmed to take a specific amount of time to download (3 seconds, 5 seconds, and 1 second respectively). Running them in WebPagetest I confirmed that the image isn’t displayed until after 5 seconds. I then implemented each of the techniques and found that:
- Resource Timing reports a time of ~1.5 seconds, which is accurate for when the image downloads but is not accurate for measuring when the image is viewable.
- The image onload handler, mutation observer, and polling techniques all report a time of ~3 seconds which is too early.
- Only the inline script timer technique reports a time that matches when the image is displayed.
This test page addresses the scenarios of a synchronous script and stylesheet. We still need to find an accurate measurement technique for the case when the image itself is slow to load. A slight variation of the test page includes a 7-second image and, of the five techniques, only Resource Timing and image onload handler correctly measure when the image is displayed – the other techniques report a time that is too early. Of those two, image onload is preferred over Resource Timing because it’s simpler and more widely supported.
Therefore, to create a custom metric that determines when an image is displayed you should take the max of the values reported by the inline script timer and image onload.
We’re all pretty familiar with image onload handlers. The inline script timer is simple as well – it’s just an inline script that records the time immediately following the IMG tag. Here’s what the code looks like:
<img src="hero.jpg" onload="performance.mark('hero1')">
<script>performance.mark('hero2')</script>
The code above takes advantage of the User Timing API. It’s easy to polyfill for browsers that don’t support it; I recommend using Pat Meenan’s polyfill. You need to take the max value of the hero1 and hero2 marks; this can be done either on the client or on the backend server that’s collecting your metrics. Refer to my test page to see live code of all five measurement techniques.
The most important thing to do is get your hero images to render quickly. Use Custom Metrics to make sure you’re doing that well.