Performance Calendar
Everyone is fascinated with the smooth animation at 60 frames/second. It is hardly a surprise that one of the most prevalent performance advices to web developers is to use hardware accelerated CSS. In some extreme cases, it is not uncommon to imply that forcing it via translate3d will automatically boost your application performance (hint: it is not the case).
Modern web browsers can take advantage of the GPU (graphics processing unit) to accelerate page rendering. Among many different features of a GPU, it can hold a limited number of textures (a rectangle of pixels) and manipulate those textures efficiently, including applying a certain transformation (translation, scaling, rotating, etc). This is extremely useful to achieve a fluid animation. Instead of drawing the pixels for every animation frame, the browser will “snapshot” the DOM element and store it as a GPU texture (often called as layer). Later, the browser will simply tell the GPU to transform the said texture to give the perception of an animating DOM element. This is called GPU compositing, naturally referred to as “hardware acceleration”.
Unfortunately, a web browser is a complex piece of software (Firefox comprises millions of lines of code). Because of this, a blanket simplified statement such as “use translate3d for performance” is likely a hit-and-miss. It is thus imperative to understand a little more as to what happens under hood so that you can understand the situation better.
Imagine for a moment that using a GPU-accelerated animation is like Vin Diesel driving Dominic’s iconic car, the Dodge Charger. Sure, with its custom 900 hp engine, it goes from 0 to 60 in a blink of an eye. But what’s the use of it when you are crawling with many other cars in a packed freeway during the rush hour? Your choice of vehicle – in this case, the Charger – is just fine. The problem is that you are still at the mercy of the traffic condition.
The same goes for GPU compositing. Many aspects of the animation still require the intervention of the CPU. After all, this is where the browser code is being executed. The bus connecting the CPU and GPU has a finite bandwidth, hence it is important to pay attention to the data transfer between them to prevent a congested channel. In other words, you should always mind the pixel traffic.
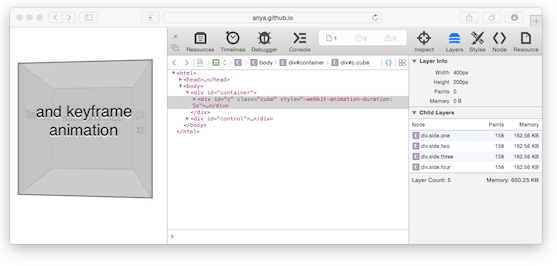
The first and foremost thing to be aware of is the number of composited layers being created. Since every layer is mapped as a GPU texture, having too many layers will exhaust the memory. This may lead to an unexpected behavior, everything from frame skipping to a potential crash. Fortunately, you can easily check those layers using the web browser itself. With Firefox, go to about:config and toggle layers.draw-borders to true. If you are a Chrome user, open chrome://flags/#composited-layer-borders and enable it. For Safari fans, first run this on your OS X terminal: defaults write com.apple.Safari IncludeInternalDebugMenu 1. Relaunch Safari and there will be an additional top-level menu Debug where you can find Drawing/Compositing Flags, Show Compositing Borders. You can also get the memory consumption of every layer by looking at the Layer sidebar in Web Inspector.
When those web browsers are configured with the appropriate flag, every DOM element that is composited by the GPU will be marked with the additional colored border (as a quick test, try it on this Spinning Cube demo). This way, it is easy to verify whether your web page has too many layers.
Another important aspect of this GPU compositing business is to keep the traffic between GPU and CPU to the minimum. In other words, the amount of layer updates is ideally a constant. Every time there is an update, a new set of pixels potentially needs to be transferred to the GPU. Thus, for performance reasons, it is important to avoid any layer updates after the animation already starts. This is possible by carefully choosing the properties to be animated: transformation (translate, scale, rotate), opacity, or filters.
If you use Safari’s Web Inspector, the Layer sidebar reveals the layer updates in the Paints field. It indicates how many times Safari uploads a new texture to reflect the content of the layer. Try it on the Colorful Boxes demo where each box alternates its color between blue and green. Unfortunately, changing the box’s background color forces a layer update and hence is why the paints number keeps increasing during the animation. With just one box it might be fine, but a hundred boxes like that will bring the GPU to its knees. While this is a contrived case, it serves as a reminder that no amount of translate3d will save the day if your pixel traffic is disastrous to begin with!
Necessity is the mother of invention. The constraints of working with layers often lead to creative and surprising ways to exploit the system. A variant of “terraforming” can be achieved by having the initial and final portions of the UI reside in the same layer with a clipping rectangle showing one part and hiding the other. Another slightly similar illusion is employing two layers superimposed on top each other. The animation is carried out by simply changing the opacity of both layers so that the result is a tweening of both, as demonstrated in this Glowing Effect demo.
Another common practice to maintain a reasonable pixel traffic is by having a pool of layers. When some layers are not needed, they are not disposed completely as they can be moved off-screen or set to fully transparent. In some cases, the user interface design implicitly permits a finite number of layers. The following screenshot shows the Cover Flow example where only 9 (nine) images are visible at any given time. Even if it is supposed to display hundreds of book covers (as the user swipes left and right), you do not need to build tons of layers at once. With a little bit of trick, you can swap the content of a layer with the new image at the right time and the user will not notice it.

Also, never forget that you must always run a profiler to double check your theory. Performance is a serious matter and it will be a mistake to rely only on gut feelings. Chrome users should enable chrome://flags/#show-fps-counter. Its equivalent in Firefox is layers.acceleration.draw-fps from about:config. With the frame rate counter, run your animation and watch it carefully. If the frame rate drops below 60 fps (or whatever threshold you are aiming for), then it is time to investigate the issue. For this, Chrome’s Timeline feature or Safari’s Timeline panel will give a detailed insight of every rendering operations: layout, painting, and compositing.
To prevent performance regressions, an automatic variant of the above step is necessary. This is where browser-perf from Parashuram becomes extremely handy. As he already wrote a few weeks ago, browser-perf gathers some important rendering statistics from running the tests on the web page. For this context, metrics for layer counts and paint counts are extremely valuable. The data enables you to trigger an alert if those values regress over time.
While many articles have been written on the subject of hardware accelerated CSS, hopefully this post serves as another quick reference on how to (ab)use GPU composited animation in such a way that it does not land us in the naughty list of 2015. Stay out of trouble and happy accelerating!