Performance Calendar » The Runtime Performance Checklist
Most performance advice today centers around Page Load Time (PLT) and this is, of course, critically important to success. We reduce or remove requests, compress our assets and minify JavaScript and CSS. It’s all good stuff, but it’s only part of the picture. The majority of the time a user spends on your site is not waiting for it to load, but rather, using it. Therefore, user frustration can come from poor UI responsiveness, slow scrolling and jerky animations. From the moment a person loads your site or app to the moment they leave they are your responsibility.
Delivering an awesome experience at 60fps is the goal, and we’ll target anything blocking us from doing that. To put this another way: any frame that takes longer than 16ms (1/60th of a second) for the browser to generate is a problem. There are several parts of a frame’s life cycle and, unsurprisingly, nearly all of them can cause you to drop frames.
With that in mind I want to highlight seven runtime performance problems that I see most often, and that your projects may suffer from.
Our first enemy in the fight against dropped frames happens early in the browser’s rendering pipeline: it’s where the browser figures out what styles apply to elements and their respective geometries i.e. their position on page, widths and heights.
Changing classes on elements and changing element styles directly through JavaScript, CSS transitions or CSS animations cause the browser to invalidate part or all of its rendering tree.
div.classList.add('active');
div.style.height = 200 + 'px'
What really matters here is how much of the document tree you invalidate. In the worst case you might invalidate the entire document tree, and that could result in the browser having to recalculate the dimensions and location of every element. That’s a terrible idea, especially if it happens when the browser is busy doing something like an animation or scrolling (hello parallax sites).
To figure out whether you’re suffering from this you should take a Chrome DevTools Timeline in Frame mode and start looking for purple blocks:
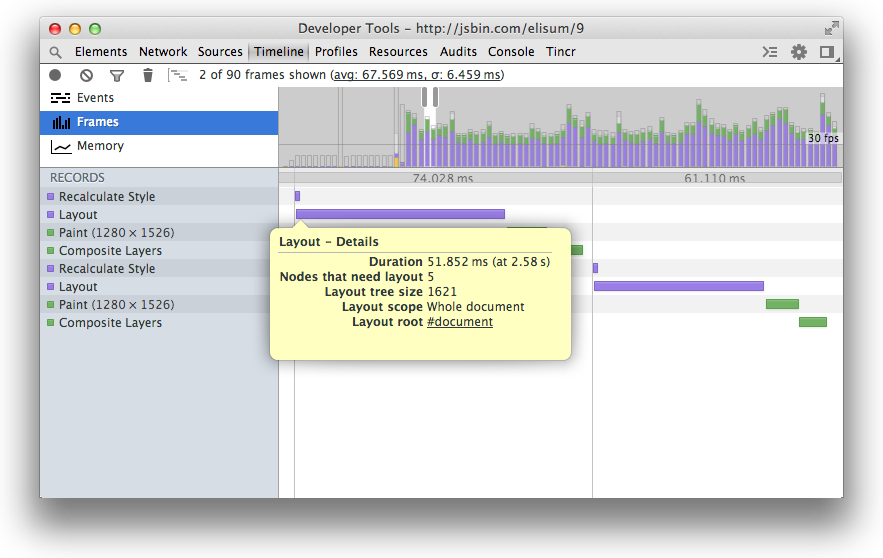
As you can see in this grab I’m spending about 50ms in layout and that the scope of the invalidation was the whole document. If you want to hit 60fps you have just 16ms to get all the work done, not just layout. In this example I’m taking nearly 3 frames for just one piece of work!
Some fixes for this:
- Avoid style changes where you can. If an element doesn’t need to change, don’t change it.
- If you do need to make changes apply them as close to the target elements as possible. Sometimes it’s tempting to go to the common parent element when you have several elements to change, but you will probably find that this invalidates a much larger part of the tree than changing just the target elements.
- The extreme layout limiter in the crowd should take a look at Layout Boundaries. They provide a point at which the browser considers it safe to stop layout operations, but the criteria are very specific, and for most people doing this will be overkill.
Once the browser has gone to the hard work of calculating the geometry of the page’s elements, one of the worst things you can do is invalidate those calculations. But it’s possible to go one step further and invalidate several times inside a single frame. You do this by putting the browser into a read-write-read-write cycle, where you continually read styles and then change element styles. Check out this code:
for (var p = 0; p < paragraphs.length; p++) {
  var para = paragraphs[p];
  var width = div.offsetWidth;
  para.style.left = width + 'px';
}
In this example I’m looping through a bunch of paragraphs and setting the width of each to match some target div. When you map this to the work that the browser has to do you’ll see that offsetWidth gets the width of the div, which requires a layout (read) and this is immediately followed by setting the first paragraph’s width (write). The write invalidates the read’s layout calculations because part of the render tree has changed. So when the browser hits the second paragraph it has to do layout again, and this is once again invalidated by mutating styles.
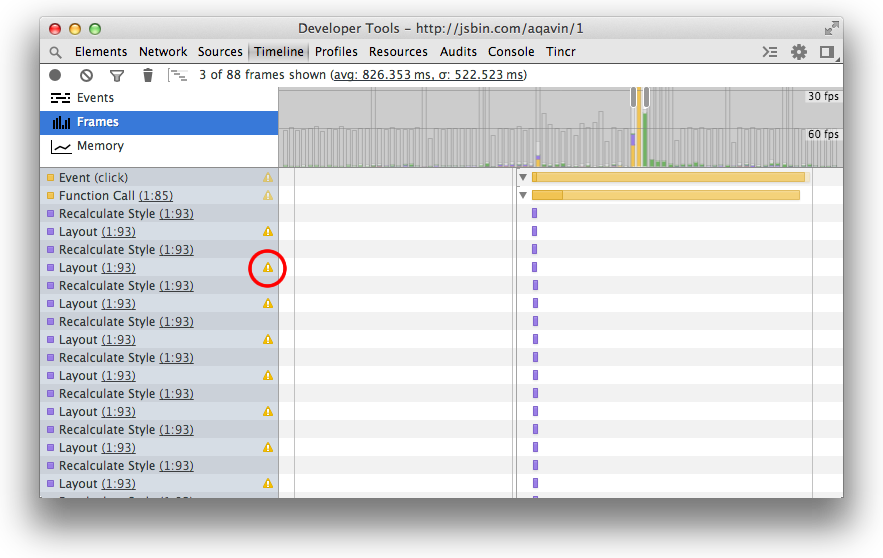
Chrome DevTools shows you that you triggered a “forced synchronous layout” (the proper term for what just happened) by putting a small warning sign into the Timeline records:
In this contrived example, the fix is simple:
var width = div.offsetWidth;

for (var p = 0; p < paragraphs.length; p++) {
  var para = paragraphs[p];
  para.style.left = width + 'px';
}
Yep, just move the width calculation outside. Now it’s read-write-write-write. In general you should do all your reads first then do all your writes. To help guarantee the read-write order Mozilla’s Wilson Page has written a small library called FastDOM.
Blink engineer Tony Gentilcore stepped through the source code of Chrome and listed out exactly what triggers a forced synchronous layout for WebKit- and Blink-based browsers like Chrome, Safari and Opera. There’s a similar list for Firefox as well.
In general terms we need to think of the browser’s rendering pipeline like a waterfall. Well more like a cliff, actually, and ideally speaking you want to start as low down as possible to avoid a painful catastrophe.
By way of a quick summary, the work that the browser has to fit into a single frame’s life cycle is:
- JavaScript
- Style calculations
- Layout
- Paint Setup & Paint
- Composite
Visualized in DevTools you will typically see a waterfall that looks like this:
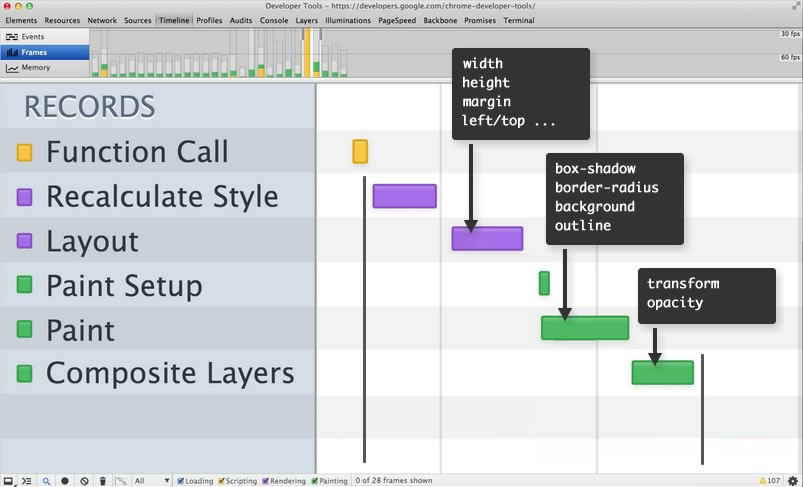
You can see I’ve included a few examples of properties that govern where on the waterfall the workload starts. So, for example, if you animate the width, height or position of an element the browser will start at layout. But then there will also be paint and composite off the back of that, both of which will take time.
If you animate a visual aspect of an element such as backgrounds, text color or shadows, you’ll take the hit for paint and composite, but if you animate transforms or opacity you will only see composites. Hopefully you can see that you want to limit animations to anything can be done entirely in the composite part of the pipeline; they are typically GPU-assisted and therefore awesome.
Paul Irish and I recently covered this in more detail over at HTML5 Rocks. If you want to get high performance animations, which of course you do, you should give it a read.
Paint Storm sounds so dramatic, I love it. In a nutshell Paint Storms are where the browser has to paint a large part (or all) of the viewport in every frame. That’s a miserable idea because paints are expensive.
To understand this a little more there are three things to know:
- Changing visual properties of an element (background, text color, border radius, shadows) will trigger a paint.
- Elements are grouped into layers which means you may end up painting several elements by just changing one.
- The browser throws a dirty area around visually changed elements. This is a union operation, which means that if you have a changed element in the top left and another in the bottom right of your screen, the area to be painted will be the whole screen (top left to bottom right)!
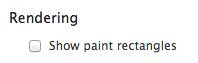
One of the best ways to find Paint Storms is the Show Paint Rectangles tool in DevTools. You can find it by hitting the cog ( ) in DevTools and then checking the Show Paint Rectangles box under the Rendering section:
Now every time Chrome paints you’ll see a flash of red on the page. If you see a full screen flash of red you have a Paint Storm, and that’s something to fix.
The most common cause here are fixed position elements like — say — a header that sticks as you scroll. In that case the browser unions the header (because it needs to be repainted during the scroll) and the newly appearing content at the bottom of the screen. Now the whole page is considered dirty and must be repainted.
The way around this is to promote the elements that need to be repainted to their own composited layer. This isolates them from other elements, so if they need to be repainted nothing else will be affected. Blink-based browsers use several criteria to determine if an element deserves its own layer in the compositor, all of which are listed over on the Chromium site. The most common of these is to apply a -webkit-transform: translateZ(0) style to the element, a 3D transform, which is one criterion in the list.
On High DPI devices Chrome automatically promotes fixed position elements, but it doesn’t do so on Low DPI devices because it drops text antialiasing from subpixel down to grayscale, and for many developers that’s a compromise they’re not willing to make. (On High DPI it’s almost impossible to tell the difference, so there’s no problem of doing it automatically.)
In my view, I would say that avoiding a whole viewport repaint on scroll outweighs grayscale-antialiased type, but that’s entirely subjective and a compromise you and your development team need to decide that you’re willing to make.
We’ve covered what you might call an “inadvertent Paint Storm”, one that arises by virtue of having position: fixed on an element. But you can also find yourself caught in a Paint Storm because you animated properties of an element that triggered paints.
Let’s now consider a perennial favorite: the parallax site. If we’re got our game face on we may well have realised that we should be using transforms for our parallaxing elements (compositing operations for the win!) but, and here’s a crucial point, transforms (the 2D variety) are not a criterion for composited layer creation. Now we’re moving elements around the page, and those elements have been grouped into a single layer. That means that layer will need to be repainted during the scroll. Again, if we have one translated element at the top of the page, and another at the bottom, the paint area will be the full viewport.
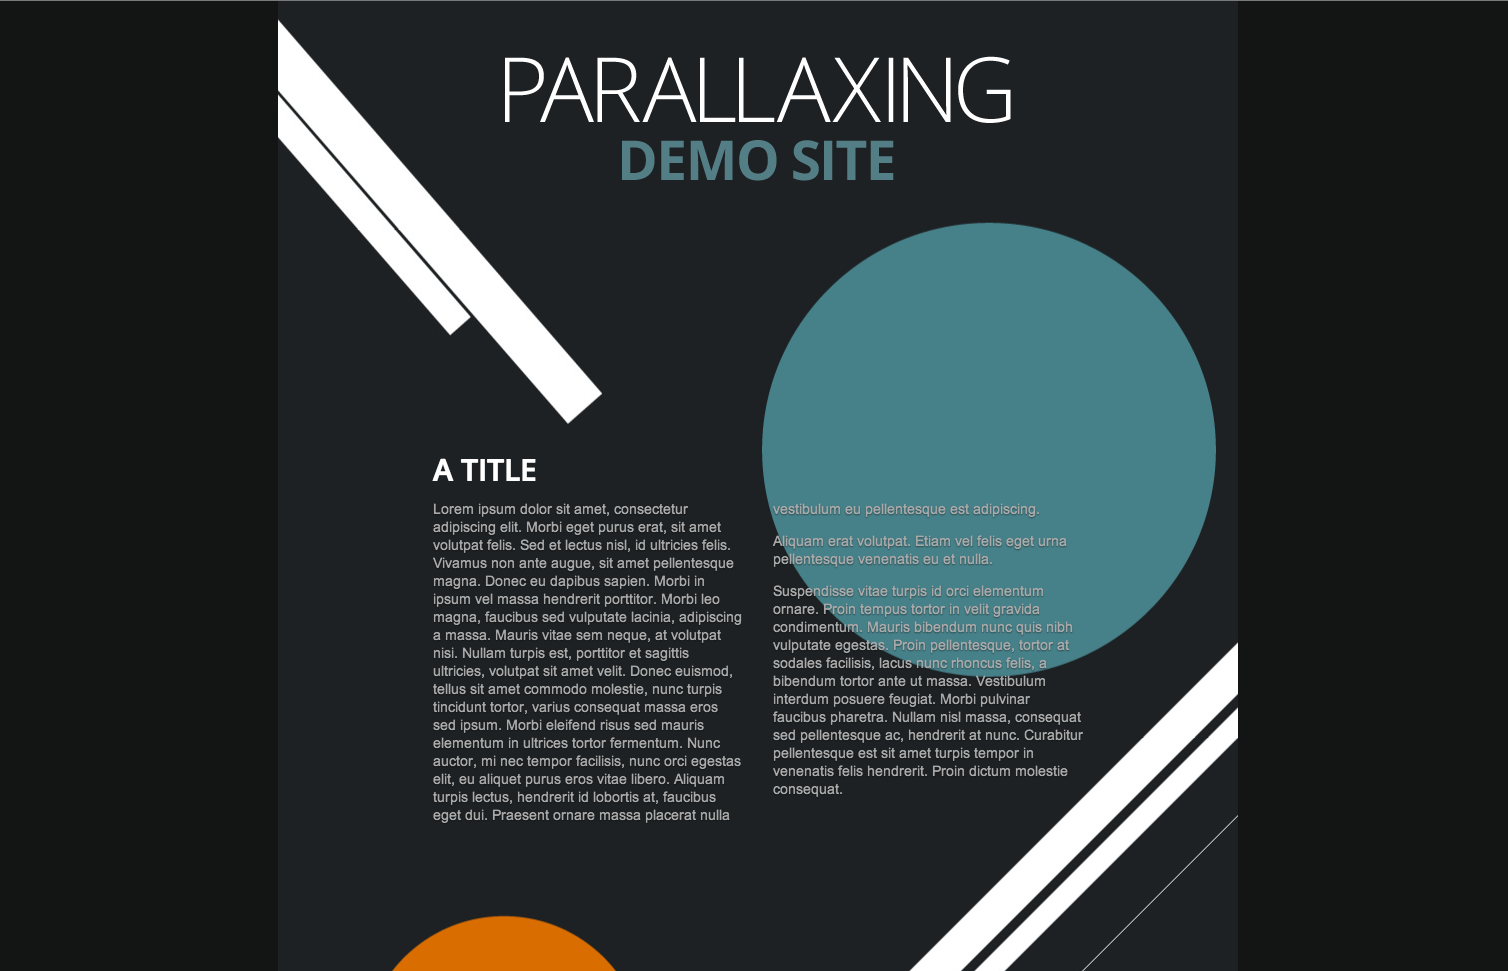
If you have to do a parallax site (I’m not judging, sometimes we all have to just pay the bills) then you should check out my article on the various ways to make that happen in a browser-friendly way.
So to summarize:
- Use Show Paint Rectangles to see if you have a paint storm.
- Avoid animating any property that will trigger a paint if you can.
- Ensure any element that is being regularly repainted has been isolated from other elements. You can use any promotion criterion, but most people use
translateZ(0)orbackface-visibility: hidden.
One final note: in the future I hope browsers will ship a better layer primitive that doesn’t require the use of hacks. I don’t like recommending hacks at all, but I’m pragmatic enough to know we need to ship high performance projects today, and that means doing some stuff that feels ick.
Now that we’ve established that you shouldn’t paint if it’s avoidable, the next issue to deal with is the times when you do have to paint. When you have to paint, the basic premise is make it cheap for the browser to get that paint work done. The question that begs is: how do you know if painting is cheap?
For that we can turn to two tools. The first we’ve already seen: the DevTools Timeline. When you see a big green block for Paint you can see immediately how long you spent painting.
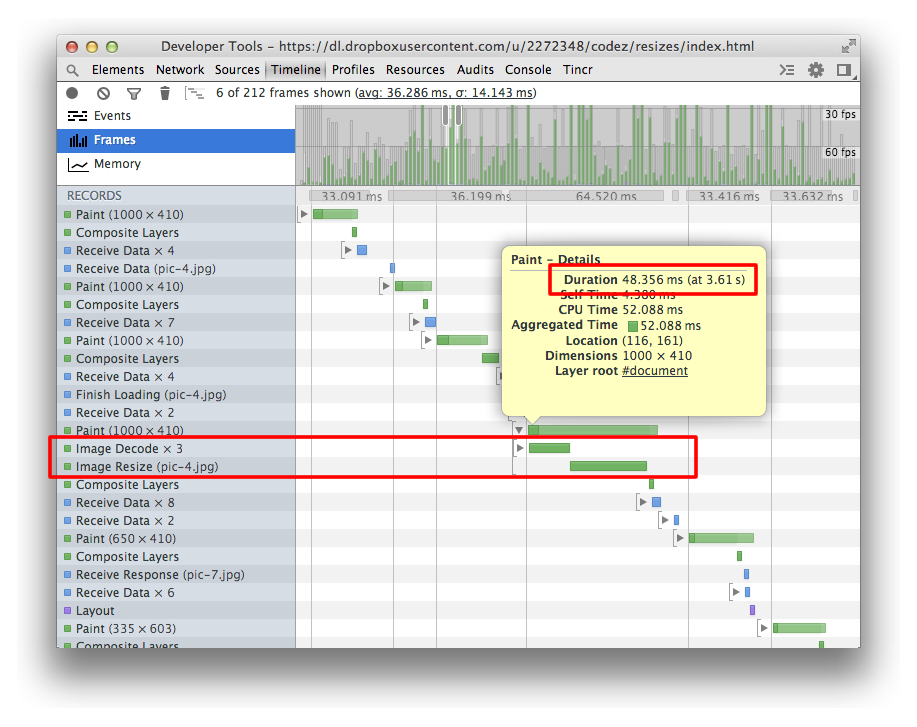
In this image you’ll see that I spent 48ms painting the screen, but interestingly you can expand that record and you’ll see that the time is spent decoding and resizing images. The takeaway here is that if you want to maintain 60fps you really want to avoid resizing images during runtime activities like scrolling or animations; they are seriously expensive. That’s not always easy, especially in Responsive Web Design, but that’s a topic for another day.
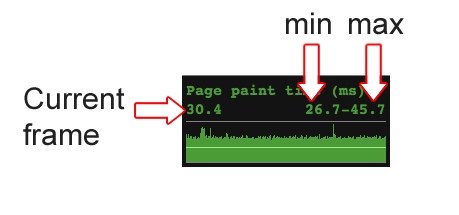
Sometimes, however, it’s not imagery that is the cause of a slow paint. That’s where the other tool in our arsenal comes into play: Continuous Page Repainting. This checkbox for this tool is found just below Show Paint Rectangles in DevTools.
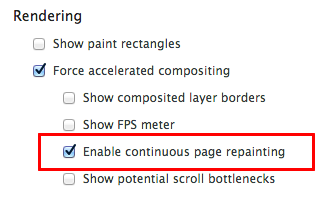
This puts Chrome into a mode where it essentially “forgets” what it painted previously and goes through the process of painting the whole screen from scratch every frame. When this mode is enabled you get a neat little chart in the top right hand corner of your page that tells you how long it’s taking to paint everything.
Sometimes there will be one expensive element that takes all the time, sometimes it will simply be the combination of a lot of smaller paints adding up. The best thing to do is to step through your DOM in DevTools’ Elements panel and toggle styles and element visibility. (Pro tip: use the ‘H’ key on your keyboard to temporarily toggle an element’s visibility for faster iteration!)
For bonus points you should also make sure to hide your animated GIFs.
It used to be the case that if you hit garbage collection (GC) in your app it would be game over for responsiveness. In the most general terms, GC stops all other activity on the main thread while it clears up allocated memory that is no longer accessible. But garbage collectors have improved a lot over the past couple of years and while technically they cause hitches, the amount of time taken by them in a single pass is significantly lower than it used to be.
That said you can still cause sizable GC pauses in your app and, because they’re unpredictable (from a developer point of view at least), you can find yourself GC’d right in the middle of an animation or interaction. This can land you a very juddery experience.
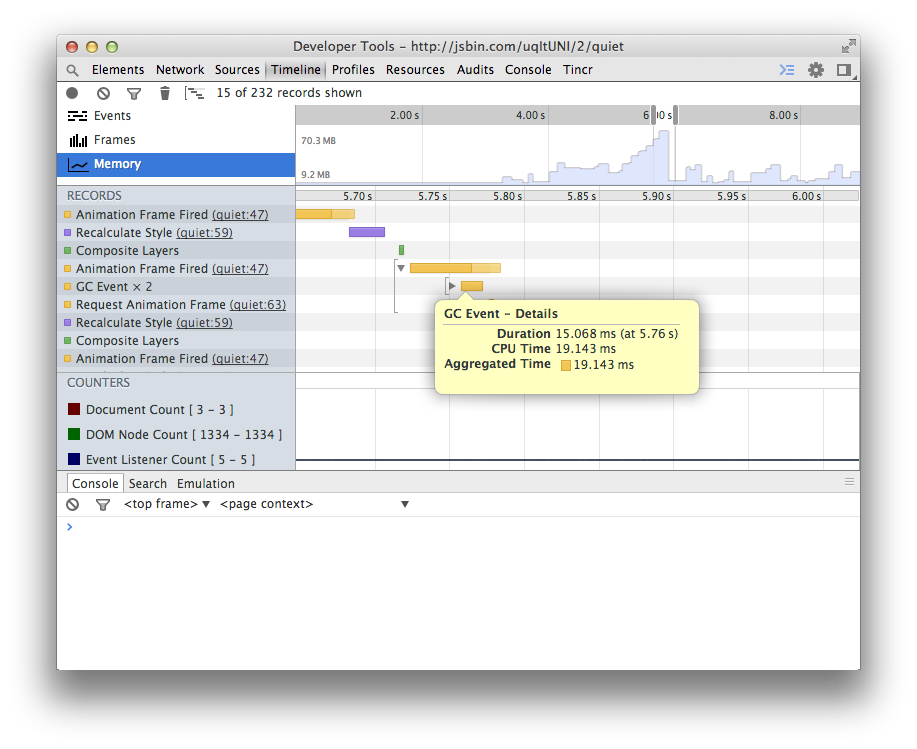
DevTools has a memory profiler that can assist you with tracking memory usage:
In general the key to avoiding long and expensive GC pauses is to avoid object creation, and ideally to reuse objects inside your loops and animation callbacks. The fewer objects you create, the less that the garbage collector has to pick up. The less the garbage collector has to pick up, the less likely you are to be hit by the GC Tax™.
Two articles for you to read if you want more on GC-avoidance: Addy Osmani on Writing Fast, Memory-Efficient Code, and Colt McAnlis on Static Memory JavaScript with Object Pools.
We’re coming to a close, but before we do we have one more area to deal with: input. Today we have a plethora of input methods and events we can listen for: scrolls, touch, mouse and orientation to name but a few.
Let’s take a look at touch events. In most modern browsers there is a separate thread called the compositor that deals with scrolling and input. It also deals with layer creation and communicates with the GPU to move those layers around the screen. When you scroll on a touch device the fast path is that the compositor receives the input event and can simply instruct the GPU to move layers around without the need for paint or any other work.
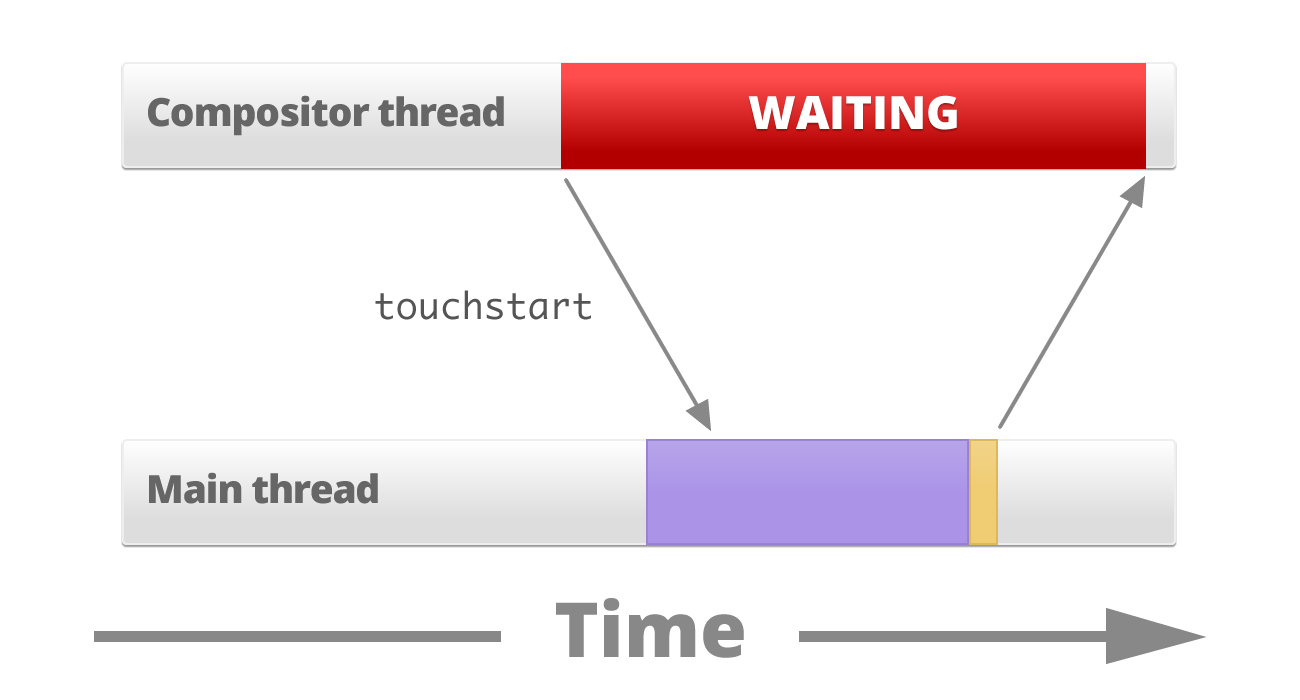
If you attach a touchstart listener then the compositor now has to wait for the main thread to execute the callback in the JavaScript VM before proceeding. This is because you could call preventDefault() and so touch scroll should be prevented.
But it’s possible that the main thread is already busy doing other work (style calculations, layout, other JavaScript) and it might not execute the touchstart callback immediately. Meanwhile the compositor thread can’t proceed with scrolling the page:
The solution here is to let the browser handle scrolls and touch if you can. If you can’t do that then bind the listener as late as possible. That is, if you don’t need a listener to be attached to an element don’t have it there. Secondly, bind the listener as close to the element as you can, ideally on the target element itself. Sometimes it’s tempting to attach a global listener to document.body and then use it as a delegate, but the problem is you’ll receive events even if the target elements are nowhere to be seen. In other words, if the elements you have a global listener for are hidden or detached from the DOM then the browser is making a trip from the compositor thread to the main thread for nothing!
Finally let’s talk about debouncing events. Many events that we’re interested in will get fired multiple times inside a single frame. One of the worst things you can do is perform any visual work inside of these callbacks because:
- You will force the browser to do work that will never be seen by the user. For example, if there are three scroll events dispatched, then the visual work done for the first two is essentially wasted time.
- Events are handled out of sync with the browser’s rendering pipeline.
What you should do instead is to simply store the values you are interested in, then schedule a requestAnimationFrame callback to deal with things at the most convenient time for the browser:
function onScroll (evt) {


  lastScrollY = window.scrollY;


  if (scheduledAnimationFrame)
    return;

  scheduledAnimationFrame = true;
  requestAnimationFrame(updatePage);
}

window.addEventListener('scroll', onScroll, false);
Now the browser can call the event handler several times inside a single frame but you will only act on it once, and at the right time in the rendering pipeline: the requestAnimationFrame callback.
It’s really tempting to memorize a bunch of do’s and don’ts when it comes to performance, but you’ll end up with a couple problems:
- You’ll misapply the rule because you haven’t established the context in which to use it. (The classic here is
-webkit-transform: translateZ(0); it gets a lot of abuse.) - Implementations change so you apply the rule when it no longer makes sense. Worse it might now be an antipattern!
Instead commit to learning about and using the profilers available to you in the browser. They reflect the implementation, so they’re the best source of truth!
I hope you’ve enjoyed this whirlwind tour of runtime performance bottlenecks, tooling and fixes. Take a look around Chrome’s DevTools and start building runtime performance goals into your projects’ success metrics.
If you want videos, articles and slide decks with in-depth discussions and details check out both jankfree.org and HTML5 Rocks.