D3 and React are two of the most popular libraries out there and a fair bit has been written about using them together.
The reason this has been worth writing about is the potential for conflict between them. With D3 adding and removing DOM elements to represent data and React tracking and diffing of DOM elements, either library could end up with elements being deleted out from under it or operations returning unexpected elements (their apparent approach when finding such an element is “kill it with fire“).
One way of avoiding this situation is simply telling a React component not to update it’s children via shouldComponentUpdate(){ return false }. While effective, having React manage all the DOM except for some designated area doesn’t feel like the cleanest solution. A little digging shows that there are some better options out there.
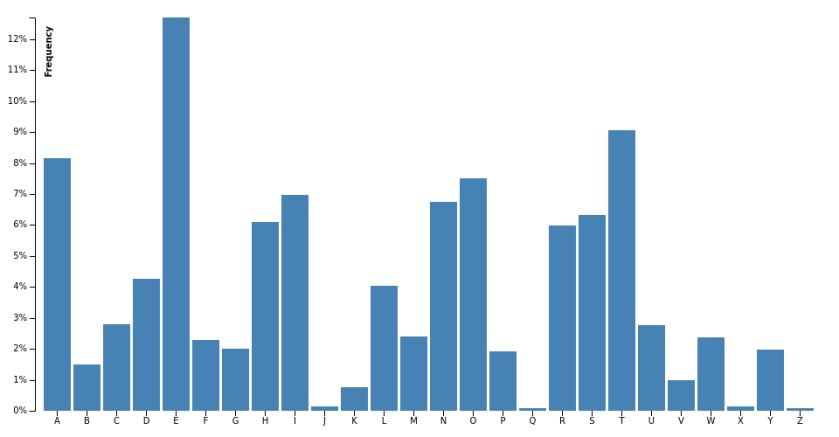
To explore these, I’ve taken D3 creator Mike Bostock’s letter frequency bar chart example and used it as the example for all three cases. I’ve updated it to ES6, D3 version 4 and implemented it as a React component.
Option 1: Use Canvas
One nice option is to use HTML5’s canvas element. Draw what you need and let React render the one element into the DOM. Mike Bostock has an example of the letter frequency chart done with canvas. His code can be transplanted into React without much fuss.
class CanvasChart extends React.Component {

  componentDidMount() {
    //All Mike's code
  }

  render() {
    return <canvas width={this.props.width} height={this.props.height} ref={(el) => { this.canvas = el }} />
  }
}
I’ve created a working demo of the code on Plunkr.
The canvas approach is something to consider if you are drawing or animating a large amount of data. Speed is also in it’s favour, but React probably narrows the speed gap a bit.
A single element is produced since the charts are drawn with Javascript no other elements need be created or destroyed, avoiding the conflict with React entirely.
Option 2: Use react-faux-dom
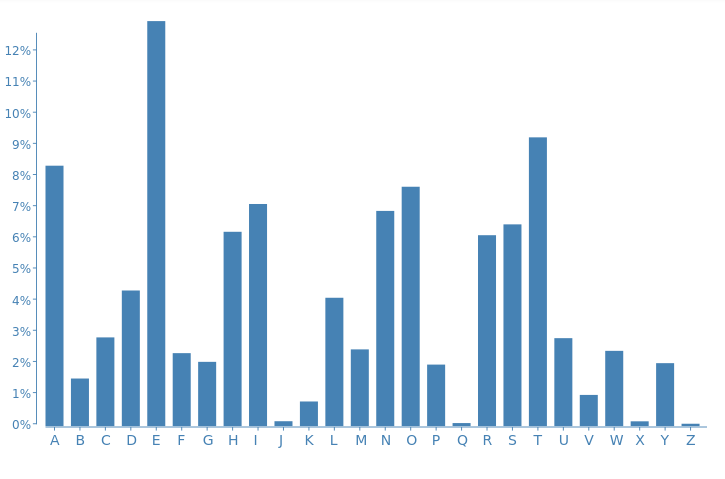
Oliver Caldwell’s react-faux-dom project creates a Javascript object that passes for a DOM element. D3 can do it’s DOM operations on that and when it’s done you just call toReact() to return React elements. Updating Mike Bostock’s original bar chart demo gives us this:
import React from 'react'
import ReactFauxDOM from 'react-faux-dom'
import d3 from 'd3'

class SVGChart extends React.Component {

  render() {
    let data = this.props.data

    let margin = {top: 20, right: 20, bottom: 30, left: 40},
      width = this.props.width - margin.left - margin.right,
      height = this.props.height - margin.top - margin.bottom;

    let x = d3.scaleBand()
      .rangeRound([0, width])

    let y = d3.scaleLinear()
      .range([height, 0])

    let xAxis = d3.axisBottom()
      .scale(x)

    let yAxis = d3.axisLeft()
      .scale(y)
      .ticks(10, "%");

    //Create the element
    const div = new ReactFauxDOM.Element('div')

    //Pass it to d3.select and proceed as normal
    let svg = d3.select(div).append("svg")
      .attr("width", width + margin.left + margin.right)
      .attr("height", height + margin.top + margin.bottom)
      .append("g")
      .attr("transform", `translate(${margin.left},${margin.top})`);

      x.domain(data.map((d) => d.letter));
      y.domain([0, d3.max(data, (d) => d.frequency)]);

    svg.append("g")
      .attr("class", "x axis")
      .attr("transform", `translate(0,${height})`)
      .call(xAxis);

    svg.append("g")
      .attr("class", "y axis")
      .call(yAxis)
      .append("text")
      .attr("transform", "rotate(-90)")
      .attr("y", 6)
      .attr("dy", ".71em")
      .style("text-anchor", "end")
      .text("Frequency");

    svg.selectAll(".bar")
      .data(data)
      .enter().append("rect")
      .attr("class", "bar")
      .attr("x", (d) => x(d.letter))
      .attr("width", 20)
      .attr("y", (d) => y(d.frequency))
      .attr("height", (d) => {return height - y(d.frequency)});

    //DOM manipulations done, convert to React
    return div.toReact()
  }

}
This approach has a number of advantages, and as Oliver points out, one of the big ones is being able to use this with Server Side Rendering. Another bonus is that existing D3 visualizations hardly need to be modified at all to get them working with React. If you look back at the original bar chart example, you can see that it’s basically the same code.
Option 3: D3 for math, React for DOM
The final option is a full embrace of React, both the idea of components and it’s dominion over the DOM. In this scenario D3 is used strictly for it’s math and formatting functions. Colin Megill put this nicely stating “D3’s core contribution is not its DOM model but the math it brings to the client”.
I’ve re-implemented the letter frequency chart following this approach. D3 is only used to do a few calculations and format numbers. No DOM operations at all. Creating the SVG elements is all done with React by iterating over the data and the arrays generated by D3.
What I learned from doing this, is that D3 does a lot of work for you, especially when generating axes. You can see in the code there is a fair number of “magic values”, a little +5 here or a -4 there to get everything aligned right. Probably all that stuff can be cleaned up into props like “margin” or “padding”, but it’ll take a few more iterations (and possibly actual reuse of these components) to get that stuff all cleaned up. D3 has already got that stuff figured out.
This approach is a lot of work in the short term, but has some real benefits. First, I like this approach for it’s consistency with the React way of doing things. Second, long term, after good boundaries between components are established you can really see lots of possibilities for reuse. The modular nature of D3 version 4 probably also means this approach will lead to some reduced file sizes since you can be very selective about what functions you include.
If you can see yourself doing a lot of D3 and React in the future, the price paid for this purity would be worth it.
Where to go from here
It’s probably worth pointing out that D3 isn’t a charting library, it’s a generic data visualisation framework. So while the examples above might be useful for showing how to integrate D3 and React, they aren’t trying to suggest that this is a great use of D3 (though it’s not an unreasonable use either). If all you need is a bar chart there are libraries like Chart.js and react-chartjs aimed directly at that.
In my particular case I had and existing D3 visualization, and react-faux-dom was the option I used. It’s a perfect balance between purity and pragmatism and probably the right choice for most cases.
Hopefully this will save people some digging.