If a 5xx happens and no one is around to see it, is it still an error?

No matter how rigorously or how long you test your software, there’s nothing like the production environment to uncover bugs. Whether it’s caused by a weird race condition that happens only under the unpredictable concurrency patterns of live traffic, or an input validation blow-up for data you could never imagine a user typing, “throwing a 500” is a big deal.
HTTP 5xx error messages are highly visible to your users, highly embarrassing for the business, and can lead to reputational damage in a very short space of time. Furthermore, debugging them in your production environment can be extremely difficult. For starters, the sheer volume of log data can make the job of isolating a problematic session like searching for a needle in a haystack. And even when you have collated logs from all components, you may still not have enough data to understand the problem.
When using NGINX as a reverse proxy or load balancer for your application, there are a number of features that can assist you with debugging in a production environment. In this blog post we will describe a specific use of the error_page directive as we explore a typical reverse proxy application infrastructure, with a twist.
Introducing the Debug Server
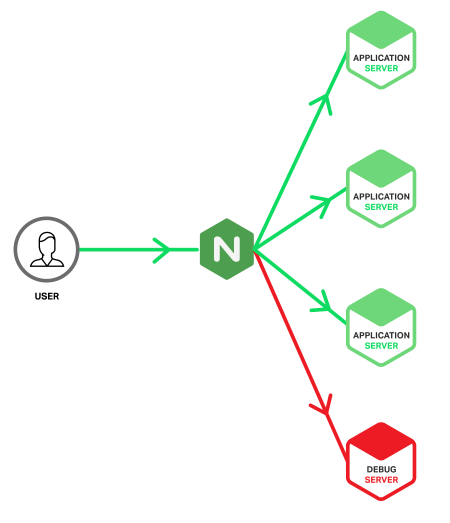
The twist is that we’re going to set up a special application server – we’ll call it the Debug Server – and feed it only requests that have caused errors on a regular application server. We’re taking advantage of how NGINX can detect 5xx errors coming back from an upstream application server and retry the responsible requests with a different upstream group, in our case the one containing the Debug Server. This means that Debug Server will only receive requests that have already produced errors, so its log files contain only erroneous events, ready for investigation. This reduces the scope of your needle search from a haystack to merely a handful of needles.
Unlike the main application servers, the Debug Server does not have to be built for performance. Therefore you can enable all of the available logging and diagnostic tools at your disposal, such as:
- Running your application in debug mode, with full stack trace enabled
- Debug logging of application servers
- Application profiling, so that interprocess timeouts can be identified
- Logging of server resource usage
Debugging tools like these are usually reserved for a development environment, because production environments are tuned for performance. However, as the Debug Server only ever receives erroneous requests, you can safely enable debug mode on as many components as possible.
Here’s what our application infrastructure looks like.
Ideally, the provisioning and configuration of the Debug Server is identical to the application servers, but there are also benefits from building the Debug Server as a virtual machine so that it can be cloned and copied for offline analysis. However, this does carry the risk that the server could be overwhelmed if a significant problem produces a sudden spike of 5xx errors. With NGINX Plus you can protect the Debug Server from such spikes by including the max_conns parameter on the server directive to limit the number of concurrent connections sent to it (see the sample configuration below).
Furthermore, because the Debug Server is not as heavily loaded as the main application servers, not everything that generates a 5xx on an application server will cause one on the Debug Server. Such situations may suggest that you are reaching the scaling limits of the main application servers and that resource exhaustion rather than a software bug is responsible. Regardless of the root cause, such situations improve the user experience by saving them from a 5xx error.
Configuration
The following sample NGINX configuration shows how we can configure the Debug Server to receive requests that have already generated a 5xx error on a main application server.
upstream app_server {
    server 172.16.0.1 max_fails=1 fail_timeout=10;
    server 172.16.0.2 max_fails=1 fail_timeout=10;
    server 172.16.0.3 max_fails=1 fail_timeout=10;
}

upstream debug_server {
    server 172.16.0.9 max_fails=1 fail_timeout=30 max_conns=20;
}

server {
    listen *:80;
    location / {
        proxy_pass http://app_server;
        proxy_intercept_errors on;
        error_page 500 503 504 = @debug;
    }

    location @debug {
        proxy_pass http://debug_server;
        access_log /var/log/nginx/access_debug_server.log detailed;
        error_log  /var/log/nginx/error_debug_server.log;
    }
}
The first thing we do is specify the addresses of our application servers in the upstream app_server block. Then we specify the single address of our Debug Server in the upstream debug_server block. Notice that we set max_fails to 1 to ensure that we send errors to the Debug Server immediately. We also set the fail_timeout parameter to 30 seconds (instead of the default 10 seconds) to give the Debug Server more time to process requests before failing.
The first location block configures a simple reverse proxy, using the proxy_pass directive to load balance requests across the application servers in our app_server upstream group (we don’t specify a load-balancing algorithm, so the default Round Robin algorithm is used). The proxy_intercept_errors directive means that any response with HTTP code 300 or greater is handled by the error_page directive. In our configuration we are intercepting only 500, 503, and 504 errors, and passing them to the @debug location. Any other response codes, such as 404s, are sent back to the client unmodified.
The location @debug block does two things. First, it proxies all requests to the debug_server upstream group, which of course contains our special Debug Server. Second, it writes duplicate log entries into separate access and error log files. By isolating messages generated for erroneous requests on the application servers from regular access messages, you can more easily correlate the errors with those generated on the Debug Server itself.
Note that the access_log directive references a special log format, called detailed. We define the format by including the following log_format directive in the top-level http context.
log_format detailed '$remote_addr - $remote_user [$time_local] '
                    '"$request" $status $body_bytes_sent "$http_referer" '
                    '"$http_user_agent" $request_length $request_time '
                    '$upstream_response_length $upstream_response_time '
                    '$upstream_status';
The detailed format extends the default combined format with a further five variables which provide more information about the requests forwarded to the Debug Server and its responses.
$request_length– Total size of the request, including header and body, in bytes$request_time– Request processing time, in milliseconds$upstream_response_length– Length of the response obtained from the Debug Server, in bytes$upstream_response_time– Time spent receiving the response from the Debug Server, in milliseconds$upstream_status– Status code of the response from the Debug Server
These additional fields in the log are very helpful in detecting both malformed and long-running requests. The latter may point to timeouts within the application or other interprocess communication problems.
Conclusion
Throwing a 500 is a big deal. Whether you’re running a DevOps model, experimenting with continuous delivery, or simply wanting to mitigate the risk of a big bang upgrade, NGINX provides you with the tools that can help you react better to issues in the wild.