The Command Line API for Fun and Profit
The Command Line API is a collection of aliases, convenience functions, and shortcuts to interact with your web page right from within the JavaScript console. In this article, we will have a look at some of those helpers and how you can leverage them for a better developing and debugging experience.
You can access your browser’s JavaScript console in a variety of ways. Usually pressing F12 and clicking the Console tab works best.
Before we dive in, let me ask you a little quiz question: Do you know what it takes to visualize the outline of your CSS layout in the browser?
Exactly 108 bytes.
[].forEach.call($$("*"),function(a){a.style.outline="1px solid #"+(~~(Math.random()*(1<<24))).toString(16)})
A tweet-sized debugger as Addy Osmani, the creator of this smart one-liner, put it. Go ahead and try it out right now. Just copy the line and paste it into the JavaScript console of your favorite developer tools, like Chrome’s DevTools, Firefox’s Firebug, Opera’s Dragonfly, Safari’s Web Inspector, or even IE’s F12 tools (although IE only supports the $ family and the console object).
While the creation of the color hex value is impressive, I want to draw your attention to the peculiar $$. This is an alias for document.querySelectorAll and one of many clever bits in the Command Line API. Let’s see what else the API has to offer.
The Command Line API is only accessible in the JavaScript console. You cannot make the API available to your scripts on the page. On the bright side, this gives you the unique opportunity to try all the code snippets in the remainder of this article right here in the browser window. Simply open your JavaScript console and experiment.
Exploring the DOM
If you are familiar with the jQuery library you can probably guess what $ does. As an alias for document.querySelector it returns a reference to the first DOM element matching the given CSS selector.
Let’s see how we can use this in the famous Cookie Clicker game. In case you never stumbled upon this monotonous but weirdly addictive game: You basically click on a big cookie to produce more of those baked goods and buy all sorts of cookie-baking devices. These then produce even more cookies… you get the picture.
Now, wouldn’t it be great if we could give our hand and mouse a break and let the console take care of the cookie clicking? With a little bit of JavaScript and our new friend $ this can be achieved in a neat one-liner:
setInterval(function() { $("#bigCookie").click(); }, 10);
As entertaining as this is, there are also scenarios where the DOM selecting functions of the Command Line API are of actual value. You already learned about the power of $$ in the introduction of this article. As an alias for document.querySelectorAll it returns an array of all the DOM elements that match the given CSS selector.
For example, we can use this function to extract all the image sources of a web site:
var pics = $$("img");
for (pic in pics) {
  console.log(pics[pic].src);
}

If you are looking for a specific element and want to examine it closer, use inspect. inspect(document.body), for example, will bring you directly to the body element in the Elements tab of your developer tools. (inspect also works if you pass a JavaScript function to it — it will take you to the Sources panel.)
Keeping Track of Objects
When I was trying to grasp JavaScript’s prototypal inheritance, I had a little friend in the console: dir called on an object this method presents you a listing of all the object’s properties, including for example prototype and _proto_. This is only one of many scenarios where dir comes in handy. I find it relieving to have a shortcut to all my object’s properties.
If you are only interested in the direct properties of your objects (i.e. properties not inherited from the prototype chain), you can use keys and values to get an array containing the names and the associated values, respectively. Try it out:
var a = {
  "one": 1,
  "two": 2,
  "three": 3
}

> keys(a)
  ["one", "two", "three"]

> values(a)
  [1, 2, 3]
Since objects are the most basic and omnipresent data structure in JavaScript, I make quite heavy use of these functions to keep track of object state.
Debugging in the Console
Whenever something goes wrong with one of my web sites or apps, the first thing I do is check the console for error messages. I spend a lot of my developing time in the console. If you are no different, then you should be excited about functions like debug and monitor. Those are just two examples of mighty debugging tools that the Command Line API puts right at your fingertips. (Unfortunately, Safari’s Web Inspector does not support these two functions.)
debug(YourLibrary.someFunction)
This sets a breakpoint at the first line of the function YourLibrary.someFunction and every time it is called, the debugger opens. Since I practically live in the console, this is a much faster alternative to skimming through the source code and setting the breakpoint manually, especially when you are working with minified code. To turn this behavior off you can simply call undebug on the same function.
If you don’t want to invoke the debugger, but just get notified whenever a certain function is called and with what arguments, monitor is your friend.
The following code in the console:
function square(n) {
  return n*n;
}
monitor(square)
will for example notify you like this in Chrome once you call square:
> square(5);
  function square called with arguments: 5
Just call unmonitor on the same function to stop monitoring. Please note, that monitor in Firebug only works with functions inside the code of your page. Please see my Stackoverflow question for more information.
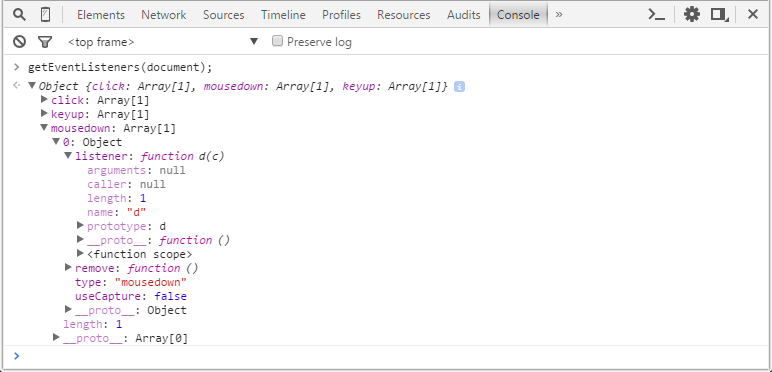
The Command Line API has also got you covered when it comes to event debugging. getEventListeners returns an object with an array for each event type (like “click” or “mousedown”) that is registered on a specified object.
getEventListeners(document);
To take this a step further, you can also use monitorEvents to get feedback in the console whether specified events are actually fired. Go ahead and type this into the console:
monitorEvents(window, "resize");
Once you resize the browser window you will get feedback in the console and the Event object for further examination. Firebug adds a nice extra and even informs you which DOM elements under- or overflow the current viewport—extremely helpful for debugging responsive layouts.
You can also specify multiple events or even choose from a list of event types:
monitorEvents(window, ["scroll", "mousedown"]);
monitorEvents(document, "key");
Please see the Command Line API reference at Google Developers for a complete list. By that time it may not come as a surprise that you can deactivate event monitoring with unmonitorEvents.
An Extra Treat for Chrome Users
Sooner or later the debugging functionality in the console will reveal some shortcomings, including:
debugandmonitordon’t work on native methodsmonitorEventsdoes not work for custom events- Missing functionality, such as breaking on object property access
Luckily, Amjad Masad has been addressing these points in his amazing Chrome extension Debug Utils (you can find the source on Github).
So How Will You Use the Command Line API Today?
The Command Line API offers a whole bunch of helpful convenience functions for an ad hoc assessment of your web pages and apps. Especially inside my debugging workflow it soon replaced the whole console.log nightmare and became one of my favorite tools.
The JavaScript console is a powerful tool that you can access right here, right now in every major browser. Are you using it? If so, what are your favorite tips and tricks?